Faithfully projecting high-dimension space

I was recently at a talk by Devika Narain (Associate professor at Donders), and one of the things she presented was their new dimensionality reduction method called RATS (Riemannian Alignment of Tangent Spaces). For some reason it really tickled my brain, so here I'll go through what the problem is and how it's solved by RATS. I'll take a view that isn't necessarily neuroscience focused, as the problem and solution are larger than what their original motivation was.
Projecting high-dimensional space
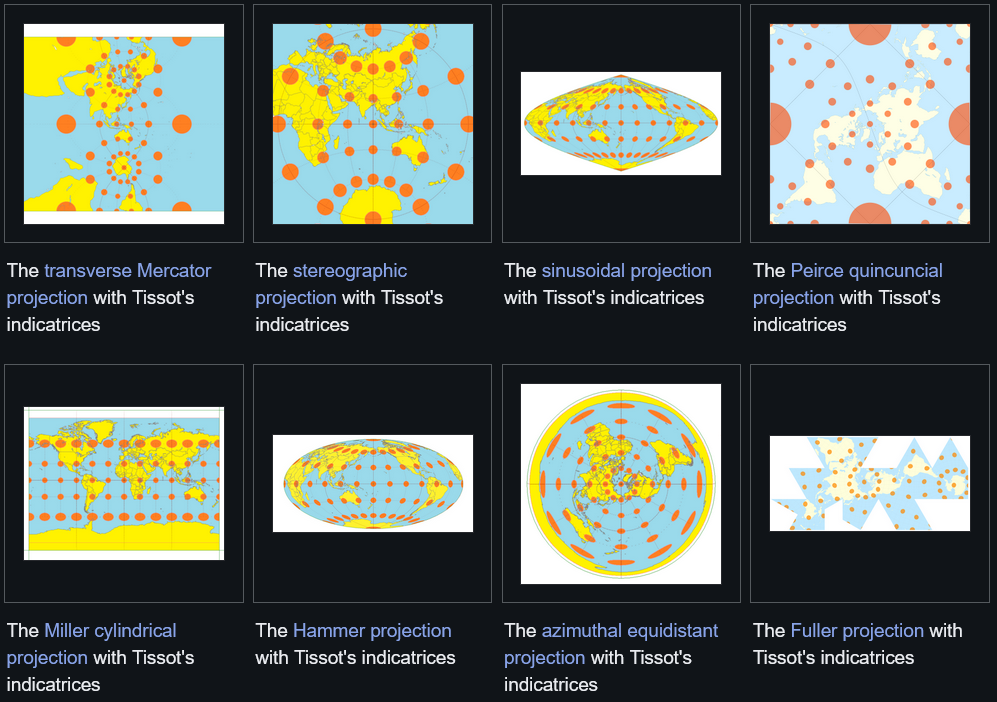
If you have data that lives in a high-dimensional space and you want to understand it, the first thing you usually want to do is visualize it. Since we can only really see in 2D (or 3D, although this is often better to avoid), that means projecting it down. This is not really a new problem: cartographers have been doing the same thing for centuries. The Earth is a 3D sphere, so you need a system for flattening these dimensions.
One such systems is the Mercator projection, which is the rectangular world map many of us have come to know. In this projection, every small neighborhood on the map looks geometrically correct relative to its immediate surroundings. But globally, things go wrong. Greenland appears roughly the size of Africa, even though Africa is about 14 times larger (as an aside, check out TheTrueSizeOf to play around with this concept). The further you get from the equator, the more areas get stretched. You can see how this kind of thing can lead to misconceptions about our world, and lead to placing more relative importance on things that appear large on the map.
The same problem shows up in dimensionality reduction. Methods like t-SNE and UMAP, which are widely used in biology and neuroscience, take high-dimensional data and project it into 2D. They do this by optimizing local neighborhoods: points that are close together in the high-dimensional space stay close together in the embedding. This works well locally, but the global structure of the data gets distorted in the process. The relative positions of clusters, the distances between them, and especially the overall shape of the data can all end up wrong. For many applications this is fine, but when the shape actually matters (as it probably does more often than we think about), it is a problem.
Going local first
The key insight behind RATS (Kohli, Nieuwenhuis et al., 2024) is that they stopped trying to solve the global embedding problem all at once. Instead, they solve many small local problems accurately, and then stitch them together. For each point in the dataset, RATS constructs a small local patch: a low-dimensional, low-distortion view of the data in that point's neighborhood. These patches are like the small tiles of a mosaic, each one accurate in its own little region.
The stitching step is where the method gets its name. Neighboring patches overlap, and those overlapping points act as anchors for figuring out how to orient each patch relative to its neighbors. RATS aligns the patches by rotating and translating them to fit together as consistently as possible, using Riemannian gradient descent to find the global alignment that minimizes distortion across all patches simultaneously.
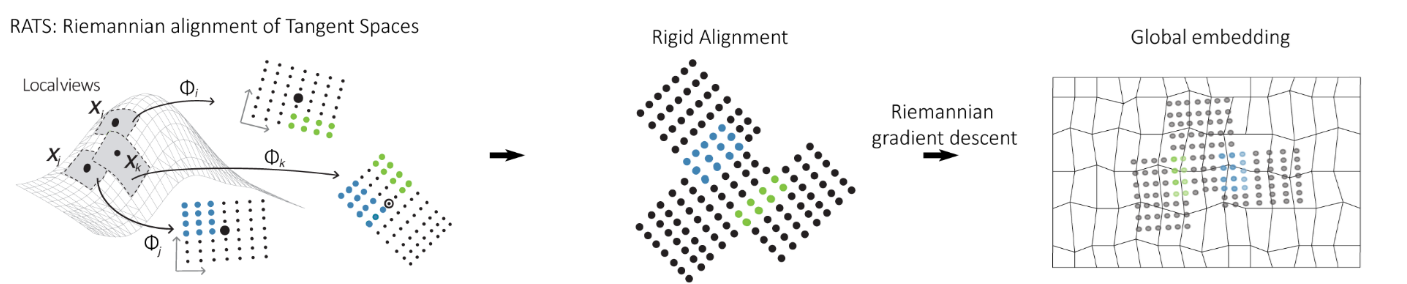
This results in a global embedding that has not sacrificed global accuracy in favor of local accuracy. Both are preserved, because the global structure arises from the stitched local structure rather than being forced by a single optimization that does not know about either.
How well does it work?
In the paper they test RATS on cases where you know what the right answer looks like. Two simple examples: data sampled from a square, and from a star shape. t-SNE and UMAP both warp these shapes, pulling corners and arms out of proportion. RATS recovers something that actually looks remarkably like the input shape, because distortion is explicitly minimized throughout.
They also handle a case that other methods tend to handle badly: closed manifolds. A torus, for example, wraps around on itself, and any flat embedding has to cut it open somewhere. RATS does this with a tearing step, and it color-codes the cut so you know which points should be identified with each other to recover the original topology. They demonstrate this for both a torus and a Klein bottle, recovering the correct topology from simulated noisy data.
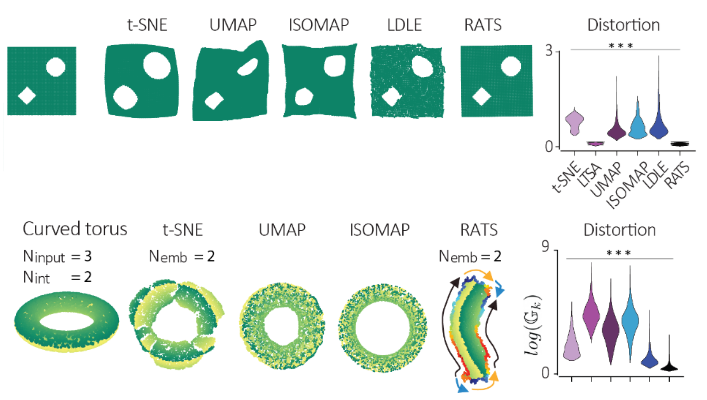
Alongside the method itself, the paper also introduces a new distortion metric for evaluating embeddings. Most existing evaluation approaches just check whether nearest-neighbor rankings are preserved, but you can preserve neighborhoods while still stretching or compressing distances. The new metric tracks local contraction and expansion directly, which is a stricter and more informative test. To me, this is one of the key points of the paper, as we can now actually compare methods quantitatively!
While motivation in the paper is primarily neuroscientific; recovering latent-space structure faithfully for understanding what neural circuits are actually doing (read the paper if you're interested in this), the problem they solved is not specific to neuroscience. Any field that works with high-dimensional data and cares about the geometry of that data, from genomics to materials science to climate modeling, faces the same issue. The tools for dimensionality reduction were developed largely for visualization and clustering, where global distortion is tolerable. For cases where the shape of the manifold is relevant to the object of study, methods like RATS seem worth giving a try. If any reader has valuable insight into how useful this could be for other research fields, send me a message.