
The Winner's Curse: Why nutritional findings keep shrinking


Throughout the 1980s, there was a set of studies that seemingly found something very interesting: people who ate more beta-carotene-rich fruits and vegetables appeared to get less lung cancer. The logic was appealing - beta-carotene is an antioxidant and a precursor to vitamin A, which would be a plausible way to reduce oxidative damage linked to carcinogenesis. Because of this, researchers launched two randomized controlled trials to test whether supplementation could actually prevent cancer.
The Alpha-Tocopherol, Beta-Carotene Cancer Prevention Study (ATBC) enrolled ~30 thousand male smokers in Finland and supplemented them with 20 mg of beta-carotene daily for five to eight years. The Beta-Carotene and Retinol Efficacy Trial (CARET) enrolled 18000 smokers and asbestos-exposed workers in the United States. Both trials found the opposite of what the observational data had suggested: beta-carotene supplementation increased lung cancer incidence by 18% in ATBC and 28% in CARET. CARET had to be stopped early because of the excess mortality in the treatment group.
That reversal is already a striking result, but researchers weren't done yet. In the 18-year post-intervention follow-up of the ATBC trial, the harmful effect of beta-carotene faded to a relative risk of 1.04 (95% CI 0.96–1.11) for lung cancer, statistically indistinguishable from no effect, and the elevated mortality disappeared within about four to six years of stopping supplementation.
So beta-carotene went from protective in observational studies, to harmful in randomized trials, to nothing in long-term follow-up. Part of this is confounding, and that part is well understood: people who eat more fruits and vegetables also tend to exercise more, smoke less, earn more, and see doctors more regularly, and each of those behaviors is independently associated with lower cancer risk. The observational studies were picking up a composite healthy-lifestyle signal and attributing it to beta-carotene specifically. When the randomized trials isolated the actual effect of supplementation, the protective association vanished.
Confounding is the standard explanation for why observational studies overestimate effects, but you could try to control for this. The pattern of effects getting smaller over time as evidence accumulates turns out to be far more general than any single confounder can explain, and the mechanism behind it is statistical in nature.
The statistical pattern
Schoenfeld and Ioannidis (2013) took a fun approach to quantifying this: they picked 50 common ingredients from random recipes in The Boston Cooking-School Cookbook and searched PubMed for studies linking each ingredient to cancer risk. 40 of the 50 ingredients had at least one published study, and of those studies, 39% concluded the ingredient increased cancer risk, 33% concluded it decreased risk, and only 28% found no association or were borderline. That means about nearly 3/4 common kitchen ingredients, things like butter, carrots, celery, corn, and lemon, have been linked to cancer in at least one direction by at least one published study.
One hint to why this happens: If you visualize the entire literature from a distance, it looks like a bell-shaped distribution of effect sizes centered near zero, except the middle is missing: studies finding no effect tend not to get published, so the journals are populated mainly by the tails. This phenomenon is called publication bias. While this concept itself is well known, the consequences it has for the size of published effects are less well known.
You can also watch this happen in the history of published effects by doing a cumulative meta-analysis. Turati et al. (2012) tracked the literature on coffee and pancreatic cancer and showed that the pooled relative risk started at 2.71 in 1981 when only a couple of studies existed, dropped to 1.32 by 1985 as more studies accumulated, and from the mid-1990s onward hovered between 1.00 and 1.10 across 54 studies and over 10,000 cases. The excess risk above 1.0 shrank more than twentyfold(!) over three decades and converged on nothing.
The winner's curse
The mechanism behind this is sometimes called the winner's curse (most commonly by Ioannidis) and it is a concept related to regression to the mean. It comes naturally from the interaction between small true effects and the reality of publishing only statistically significant results.
Suppose the true effect of some dietary factor on cancer is a relative risk of 1.05, which is realistic for most single-nutrient associations. You run a study with a few hundred participants per group. Most of the time your estimate will land near 1.05 but fail to reach p < 0.05, and those results mostly stay hidden from the rest of the world. The studies that do cross the significance threshold are the ones where random variation pushed the estimate well above the truth. The published literature is therefore a systematically inflated sample of reality.
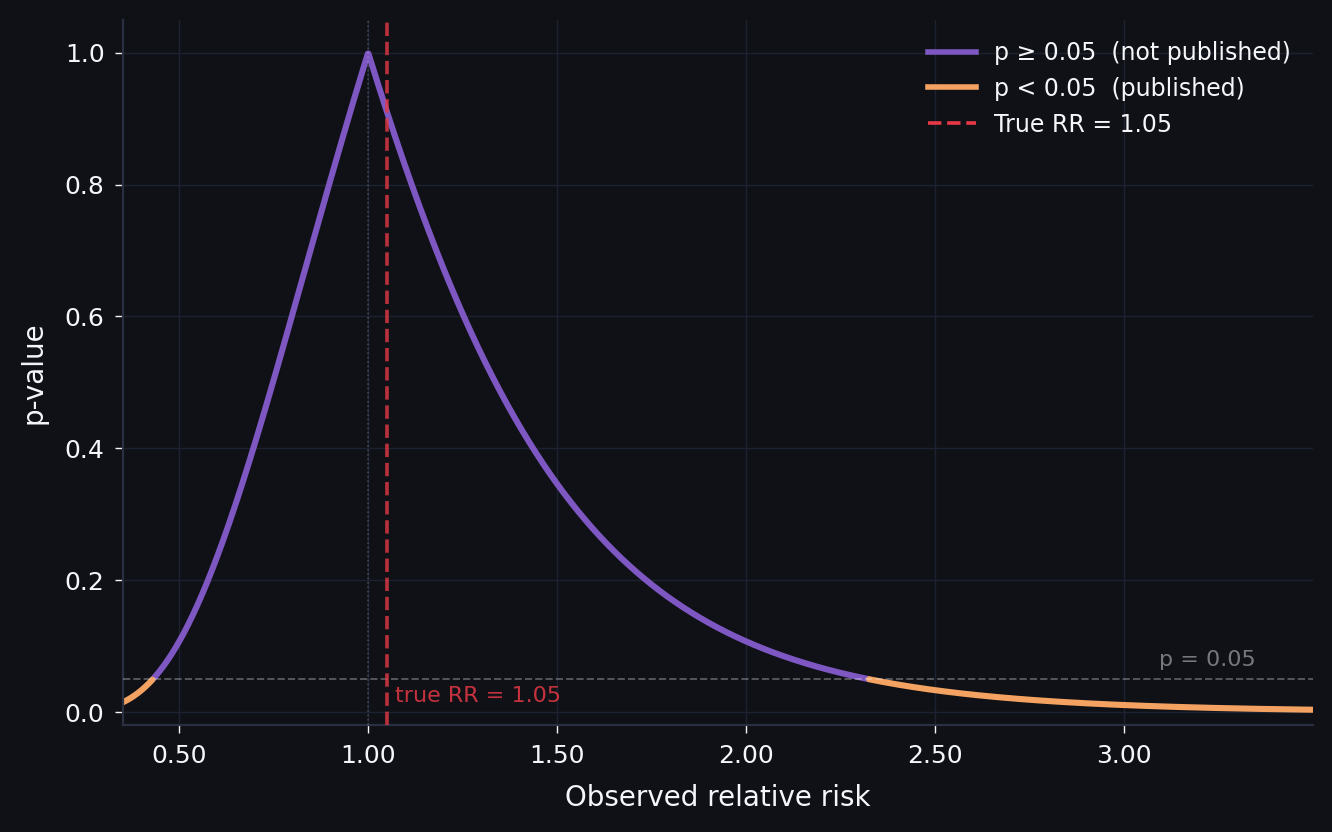
The key insight is that this distortion scales inversely with the size of the true effect. Instead of walking through the math, in the figure below you can see how this works. I generated a group of hypothetical studies at three different true effect sizes and compared the distribution of all results with the distribution of only the published ones (those that reached significance). The assumptions are that each study has 200 participants per group, the baseline event rate for whatever disease or outcome you're studying is 5%, the standard error of the log-relative-risk is derived from those parameters, and studies are published only if they achieve two-sided p < 0.05 in the direction of the effect.
Simulation: 8,000 studies per draw · SE of log(RR) from binomial variance · published if two-sided p < 0.05 in the direction of effect
This effect is also why some compounds like curcumin stay "promising" in perpetuity. Curcumin, the yellow pigment in turmeric, has been the subject of thousands of preclinical studies showing activity against cancer, inflammation, neurodegeneration, and seemingly everything else. A 2017 review in the Journal of Medicinal Chemistry classified curcumin as both a PAINS compound (pan-assay interference compound, meaning it tends to produce false positives in lab assays) and an "invalid metabolic panacea." At the time of that review, over 120 clinical trials had been conducted. None of the double-blinded, placebo-controlled trials had shown clear efficacy. A 2023 systematic review of clinical trials on curcumin and cancer progression reached the same conclusion: the compound does not appear to be effective at blocking or slowing cancer in humans. And yet the small, hopeful trials keep getting published every year, each one showing a suggestive result in a handful of patients or in vitro work, and each one contributing to a literature that looks superficially promising if you read only the individual papers.
Reality is worse
On top of the statistical filtering problem, diet has a confounding structure that is worse than in most other areas of epidemiology. Everything in people's lives correlates with pretty much everything else, and you can try to adjust for confounders in your statistical model, but there are always more than you can measure, and the ones you do measure are themselves imprecise. What this means in practice is that early studies, which tend to adjust for fewer confounders, will report larger effects, and follow-up studies that add more controls will see the estimate shrink, because the confounding was always there and the earlier studies simply could not account for all of it.
Dietary measurement itself adds another layer. Most large epidemiological studies rely on food frequency questionnaires that ask people to recall what they ate over weeks or months, which introduces substantial random measurement error. In theory, random error should attenuate the true effect toward zero, but combined with the significance filter it creates the problem: you need a bigger statistical fluke to push a noisy estimate over the significance threshold, so the studies that make it through tend to be the ones where measurement error and the true effect happened to align in the same direction.
What this means
Observational nutrition research can and does find real effects when those effects are large enough. The problem is that these large effects make up a small fraction of the published literature. The majority of published findings concern small effects where the winner's curse, confounding, and measurement noise inflate early estimates.
I should mention there is still an unresolved disagreement in the field about how deep this goes. For now, it's important to realize this effect is present in literature, and what we can do to minimize the effects. To me, the biggest things are: we need to have large sample sizes even for small initial studies if possible, and more importantly, we need to normalize and fund publishing null-results.